
Explore an executive dashboard in Alli
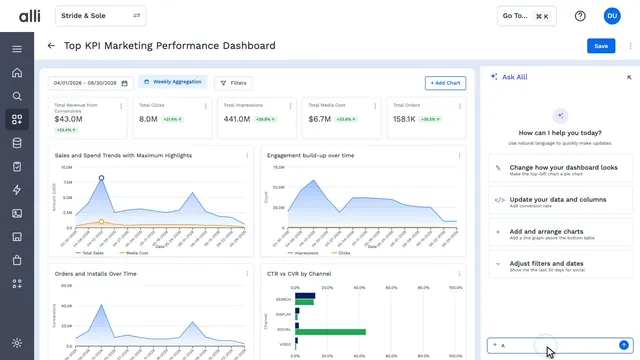
An executive performance dashboard in Alli Generative Dashboards fills in with KPI tiles, sales and spend trends, impressions against clicks, orders and installs over time, and CTR against CVR by channel. These are the views teams build first: KPIs and trends on one page for a leadership review, ready to share.
Back to the tour Alli Generative Dashboards in action
What you'll see
- 0:00An executive performance dashboard loads with KPI tiles for sales, clicks, impressions, media spend, and orders.
- 0:04A tooltip on the sales and spend trend shows the value for a single day.
- 0:07The impressions and clicks chart and the orders and installs chart fill in.
- 0:10Hovering over CTR against CVR by channel shows one channel's CTR.
About Alli Generative Dashboards
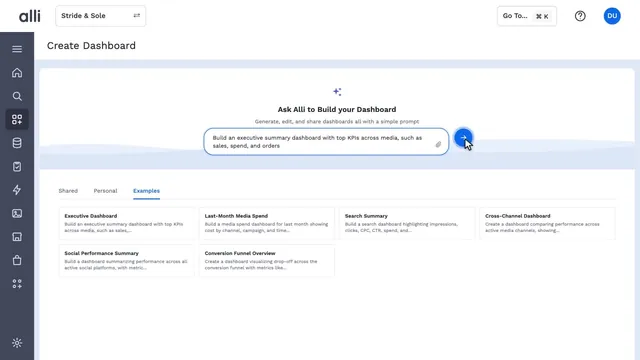
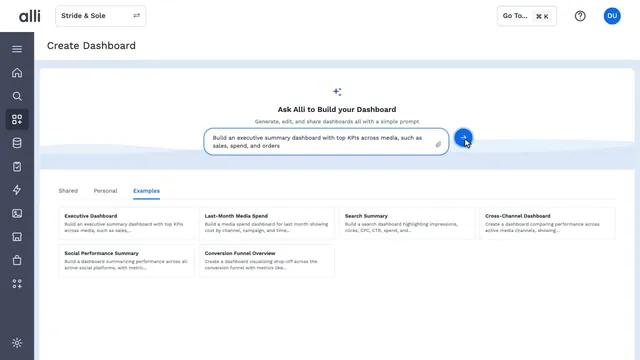
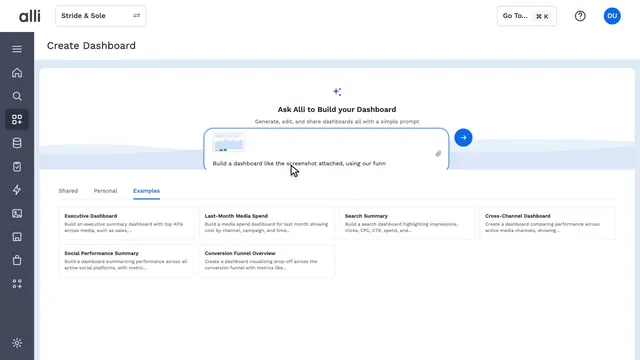
Alli Generative Dashboards builds interactive dashboards from plain-language requests, sketches, or screenshots, on live, governed data. No code required.
Explore Alli Generative DashboardsMore Alli Planning videos
See Alli working on your data.
Book a walkthrough and we'll show you the product live, on your own platforms and numbers.
Book an intro