
Measurable growth with Alli.
Prove impact and put the next dollar where growth is.
Alli connects brand signals, media performance, and sales data in one governed system, so marketing can show what its investment returned, finance can see how it was measured, and leaders can model where the next dollar should go before they spend it.
Last updated

“Live sports advertising has long been a powerful awareness driver for QSR brands, but we needed it to do more, we needed it to drive real, measurable business impact.”
What is measurable growth?
Measurable growth is growth you can explain: what marketing invested, what it changed, why it worked, and where the next dollar should go. It connects three things that usually live apart: brand strength, media performance, and business results, so they can be measured on the same evidence.
Most measurement stops at the past. It reports what happened after the money is spent. Measurable growth closes the loop. The same data that explains last quarter's results models the next quarter's choices, so every budget decision starts from what the last one taught.
Reporting tells you what happened. Measurable growth tells you what to do next.
Why is marketing impact so hard to prove?
The work is happening. The harder problem is connecting it to outcomes in a way finance will sign off on. Four gaps get in the way.
Brand and performance live apart.
Brand teams track reputation. Performance teams track clicks and sales. Without one model connecting them, brand investment looks like a cost and performance gets credit for demand it didn't create.
Models arrive after the decision.
Traditional marketing mix modeling lands as a periodic report, often after the budget has already been set.
Every report has its own math.
When platforms, markets, and teams define metrics differently, nobody trusts the total.
Problems surface too late.
By the time a weekly report shows wasted spend or a stalled campaign, the money is already gone.
How does Alli prove marketing impact?
Alli proves impact as a loop. It defines success once, measures brand and performance on the same foundation, models what each dollar is likely to return, shows the results in a form leaders read, and watches the plan while it runs. Then the results feed the next plan.
- 01
Define
One set of KPI definitions for marketing and finance.
- 02
Measure
A weekly brand equity score alongside media and sales results.
- 03
Model
Brand and sales modeled together to forecast the return on a budget change.
Alli Scenario PlannerWith Alli Brand Equity signals - 04
Show
Executive dashboards and summaries built from a sentence.
- 05
Track and protect
The plan tracked against actual spend, with alerts when something goes off course.
Results feed the next plan
| The question leaders ask | How Alli answers it | Product |
|---|---|---|
| "Is our brand investment working?" | A weekly, evidence-based brand equity score, tied to your primary business KPI | Alli Brand Equity |
| "What did marketing actually return?" | Brand and media modeled together against sales | Alli Scenario Planner |
| "Where should the next dollar go?" | What-if scenarios with diminishing-return curves, before spend is committed | Alli Scenario Planner |
| "Can I see it in one view?" | Interactive executive dashboards built from a plain-language request | Alli Generative Dashboards |
| "Are we spending to plan?" | Planned spend mapped against actuals | Alli Media Planner |
| "Is anything going wrong right now?" | Anomaly, pacing, and no-spend alerts delivered to Slack | Alli Alerts |
| "Are we all using the same numbers?" | KPIs defined once for every team and tool | Alli Semantic Layer |
Make brand investment something you can prove
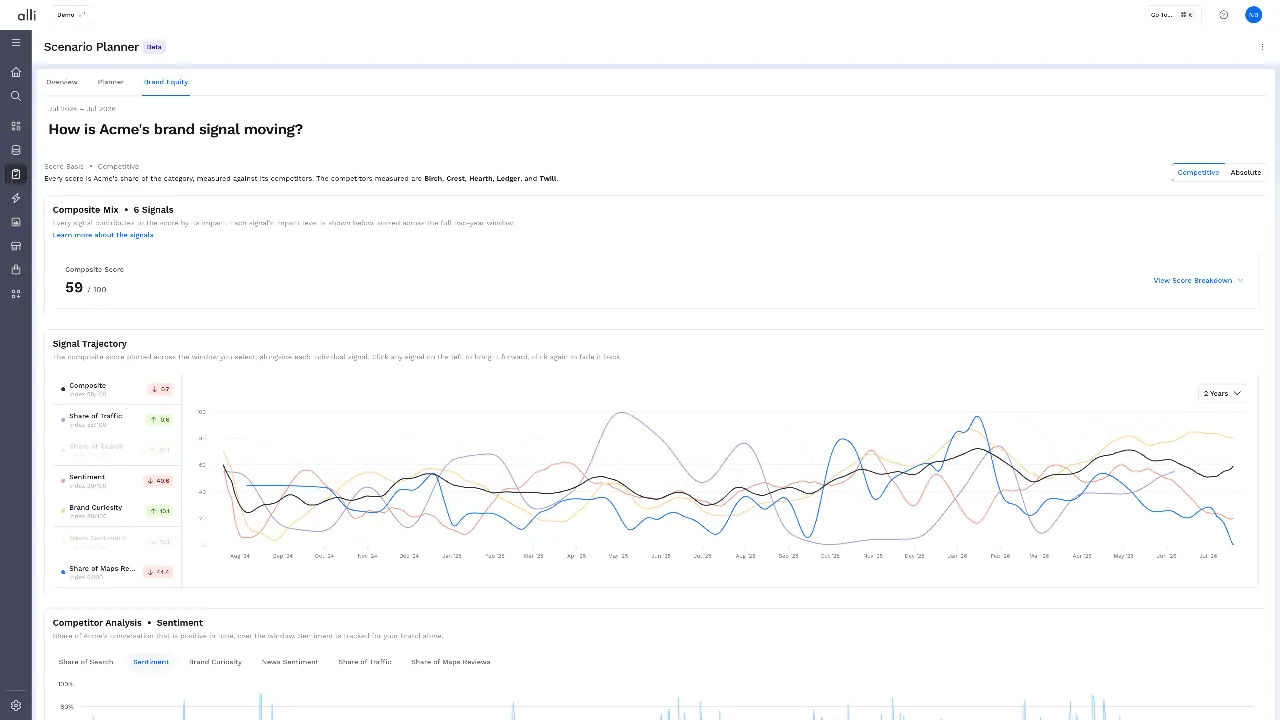
Brand budgets are usually the first to be cut because they're the hardest to defend. Alli Brand Equity changes that by giving brand health a weekly, evidence-based score from 0 to 100, built from what people, press, and markets actually do. Each signal is weighted against your primary business KPI, so the score reflects what matters to your business, and brand walks into the budget meeting with proof.
- Four dimensions: Consumer Mindshare, Consumer Trust, Authority, and Stability.
- Two views: against your competitive set, and against your own history.
- Share of LLM Presence: how AI models describe and recommend your brand against competitors.
FXTM saw a 200% lift in brand preference among UAE investors, a 120% lift in familiarity, and 32% ad recall, with the brand gains measured on the same foundation as its performance results.
Read the FXTM story
“PMG didn't just give us a beautiful, striking campaign; they redefined how our brand connects with high-value investors.”
Connect reputation to revenue, and model the next dollar
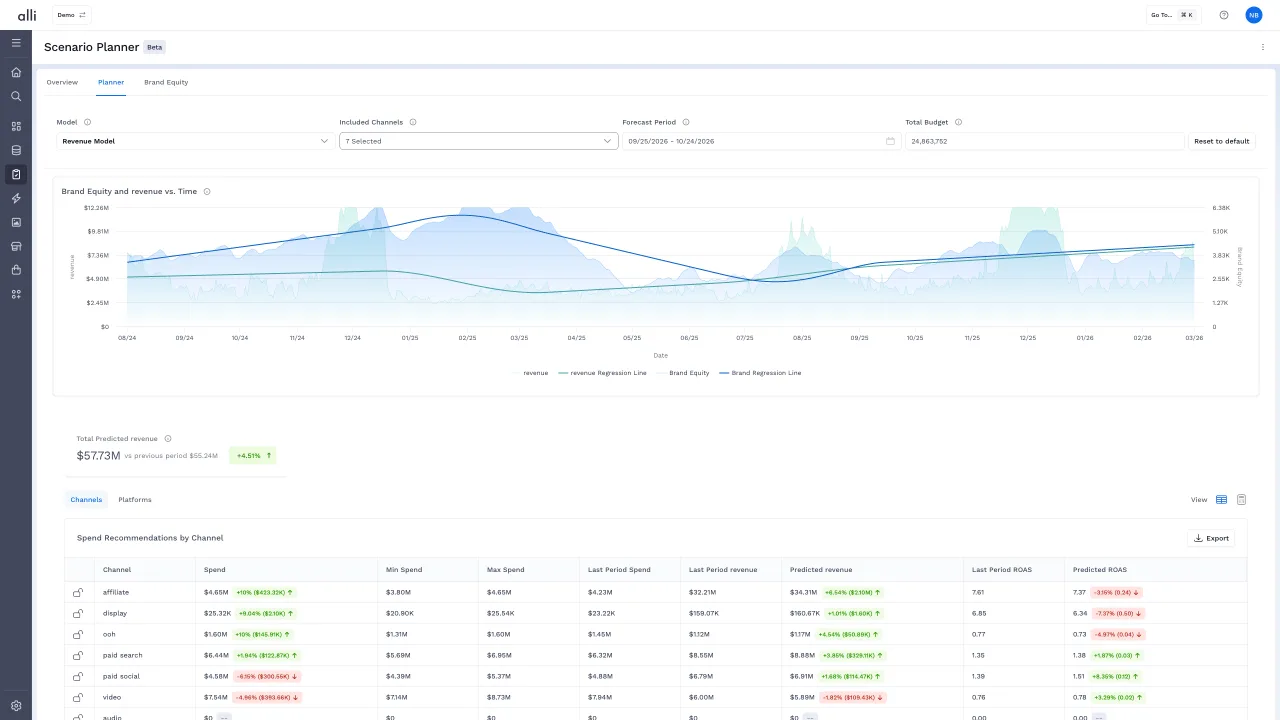
Most models measure the moment of sale and miss the brand conditions that made it more likely. Alli Scenario Planner pairs media response modeling with Alli Brand Equity signals, so you can see both what media drove directly and how brand strength made growth easier. Alli Scenario Planner puts that model in an interactive environment, so you can test a budget shift and see the likely revenue impact before you commit a dollar.
- Brand and sales in one model: Two-stage estimation separates direct media effects from accumulated brand value.
- What-if scenarios: Compare spend levels and channel mixes side by side.
- Diminishing-return curves: See where more spend stops producing efficient growth.
Kohler treated brand storytelling and performance accountability as one learning loop, using brand signals alongside performance to guide investment, and saw a 19% increase in marketing mix model ROAS.
Show the impact in a form leaders read
Proving impact only matters if the right people see it, and most executive reporting takes weeks to build and is out of date when it arrives. Alli Generative Dashboards builds an interactive dashboard from a plain-language request, a sketch, or a screenshot, on governed data. Insights and summaries sit next to the charts, so the dashboard explains what changed, not just what the numbers are.
"Show me revenue, brand equity, and media spend by market for Q3."
The story sits alongside the charts.
Every view uses the KPI definitions in Alli Semantic Layer.
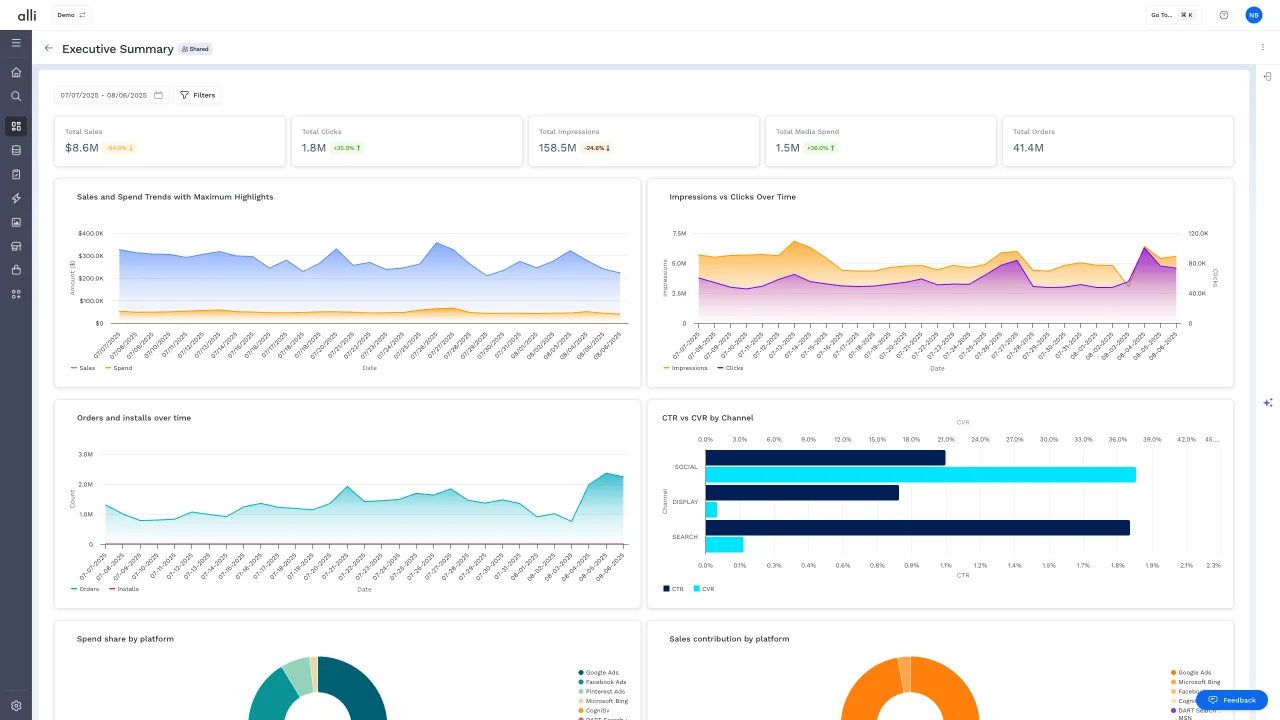
Teams move from a strategic question to an interactive executive dashboard in minutes, instead of waiting through a multi-week build, and surface insights 30 times faster than with traditional BI tools.
Keep the plan accountable while it runs
Measurement isn't only a quarter-end exercise. Alli Media Planner maps planned spend against actual performance from the first day of spend, so variance shows up without manual reconciliation. Alli Alerts watches for anomalies, pacing problems, and campaigns that stop spending, and tells the team in Slack before small issues get expensive.
- Plan vs actuals: Every budget change has a history and an owner.
- Early warnings: Budget caps, no-spend alerts, and anomaly detection.
- Protected spend: Broken landing pages and feed failures get caught before they waste budget.
Brands moving to Alli Media Planner cut the manual data work of plan reconciliation by 40%. Media Planner manages billions in media spend across every PMG client.
Teams using Alli Alerts cut manual troubleshooting time by 80%.
How does Alli compare to traditional marketing measurement?
Most companies measure marketing with some mix of attribution, periodic marketing mix modeling, and brand tracking studies. Each answers part of the question. None of them connects brand, performance, and the next budget decision on their own.
| Last-click attribution | Traditional MMM | Brand tracking studies | Alli | |
|---|---|---|---|---|
| What it measures | The last touch before a sale | Media's contribution to sales | Awareness and perception | Brand, media, and sales together |
| Brand impact on revenue | Not measured | Usually limited | Measured, but not tied to revenue | Brand equity modeled alongside sales |
| How current | Daily, but narrow | Periodic reports | Quarterly or annual | Weekly brand score, with scenarios on demand |
| Forward-looking | No | Some, in the report | No | Interactive what-if scenarios before spend |
| Stability | Shifts with tracking changes | Can swing as new data lands | Depends on sample | Layered model designed to reduce noise |
| Shared with finance | Rarely | In a slide deck | Rarely | Same KPI definitions and dashboards for both teams |
What do CMOs and CFOs get from Alli?
Measurable growth works when marketing and finance agree on the evidence. Alli gives both sides the same numbers, the same models, and the same view.
Walk into budget conversations with a brand equity score, modeled revenue impact, and scenarios for the next dollar, so brand and performance compete on equal footing.
See how marketing is measured, using the same KPI definitions finance uses, with plan-vs-actual spend and the assumptions behind every scenario visible.
For brand leaders
Show what brand investment contributes, in a number that updates weekly.
For performance leaders
See how brand strength is making paid media more efficient, and where more spend stops paying back.
For analytics teams
Spend less time assembling reports and more time explaining what changed.
Customer impact stories
Measurable growth looks different in every business. These are some of the results customers have seen with Alli.

“We met our audience in moments that mattered to them and translated that connection into momentum for the business.”
lift in brand preference among UAE investors
increase in MMM ROAS by measuring brand and performance together
sales forecast after acting on an emerging trend, from audience read to launch in days, not weeks
localized assets launched in one day, with 25% higher ROAS than manual campaigns
more high-value leads at a 20% lower cost per lead
of accounts unified around one shared data foundation, so every market measures performance the same way
partners aligned through one launch view, with a 21% lift in branded search
What should marketing leaders be able to answer?
Whatever tools you use, these are the questions a measurement system should help you answer. If any take more than a day, there's a gap.
What did last quarter's marketing return, and how was that measured?
How much of our growth came from brand strength, and how much from media?
Is our brand getting stronger or weaker against competitors this week?
Where does more spend stop producing efficient growth?
If we moved 10% of budget between channels, what would likely happen to revenue?
Are we spending to plan, and who approved each change?
Do marketing and finance agree on the numbers?
The ideas behind measurable growth
- What is marketing mix modeling?A statistical method that estimates how much each channel and outside factor contributed to sales, so teams can plan where to invest next.
- What is incrementality in marketing?The extra result marketing caused, compared with what would have happened anyway without it, usually measured with a test and a control group.
- What is brand equity?The value a brand adds beyond the product itself: how strongly people know, trust, and choose it, and how that preference shows up in pricing power and sales.
- What is marginal ROAS?The revenue produced by the next dollar of spend in a channel, as opposed to the average return on every dollar already spent.
Measurable Growth FAQ
How Alli measures impact, connects brand to revenue, and helps plan the next dollar.
How does Alli help prove marketing ROI?
Alli connects brand signals, media performance, and sales data on one governed foundation. Alli Brand Equity scores brand health weekly, Alli Scenario Planner models brand and media against revenue, and Alli Generative Dashboards shows the results to leaders. Marketing can show what it returned, and finance can see how it was measured.
How does Alli measure the impact of brand on revenue?
Alli Scenario Planner pairs media response modeling with Alli Brand Equity, which scores brand strength across four dimensions: Consumer Mindshare, Consumer Trust, Authority, and Stability. Two-stage estimation separates the direct effect of media from the accumulated value of brand strength, so teams can see how reputation makes performance more efficient and supports future revenue.
How is Alli different from traditional marketing mix modeling?
Traditional MMM usually arrives as a periodic report and can swing as new data lands. Alli's layered model is designed for stability, includes brand equity signals alongside media, and runs in an interactive planning environment, so teams can test budget scenarios before decisions are made instead of reading about them afterward.
How does Alli help decide where the next marketing dollar should go?
Alli Scenario Planner lets teams shift spend across channels and compare the projected revenue impact side by side. Diminishing-return curves show where more spend stops producing efficient growth. Leaders see the tradeoffs before committing budget, and the assumptions behind each scenario stay visible for finance.
Do we have to choose between brand and performance investment?
No. Alli measures them together, so teams can see how brand strength lowers acquisition costs and supports performance, and how performance results feed back into brand. Kohler used that approach to balance both and saw a 19% increase in MMM ROAS. Budget decisions consider short-term results and long-term growth at once.
How often is brand equity measured in Alli?
Alli Brand Equity updates weekly. It indexes each signal from 0 to 100 and weights signals for each brand against its primary business KPI. A few sources only report monthly, so those are estimated between updates and replaced when the real figure arrives. Teams see both a competitive view and an absolute view.
How do executives see the results?
Through Alli Generative Dashboards. Leaders or analysts describe the view they need in plain language, and Alli builds an interactive dashboard on governed data, with summaries that explain what changed. Teams move from a question to an executive view in minutes, instead of waiting weeks for a new report.
How does Alli get marketing and finance to agree on the numbers?
Alli Semantic Layer defines every KPI once, and every dashboard, model, and AI answer in Alli uses those definitions. Finance sees the same numbers marketing sees, plan-vs-actual spend in Alli Media Planner, and the assumptions behind every scenario, so budget conversations start from shared evidence.
Does Alli replace our attribution or MMM provider?
Not necessarily. Many teams keep existing attribution for day-to-day optimization. Alli adds what those tools usually lack: brand equity measured weekly, brand and media modeled together, interactive scenarios for the next budget decision, and one set of definitions shared with finance. Talk to us about how it fits your current setup.
Keep exploring why teams choose Alli
Data You Can Trust
Why teams trust Alli's numbers enough to use the tools, and how AI works alongside your experts.
See how Alli earns trustBuilt by PMG
The story behind Alli, built by the practitioners who use it every day.
Read the story behind AlliThe Alli Platform Explained
How Alli connects, governs, and activates your data across four pillars.
See how the Alli platform worksWalk into your next budget meeting with proof.
Book a walkthrough and bring the budget decision you're preparing for. We'll show you how Alli measures what your marketing returned and models where the next dollar should go.